


ML Systems
Simpledorff: Krippendorff's Alpha on DataFrames
Calculate Krippendorff's alpha on a pandas DataFrame in one line and understand what the agreement score measures.

tl;dr
Calculate Krippendorff’s Alpha on any DataFrame in two lines. Repo is here
!pip install simpledorff
import simpledorff
import pandas as pd
Data = pd.read_csv('./examples/from_paper.csv') #Load Your Dataframe
simpledorff.calculate_krippendorffs_alpha_for_df(Data,experiment_col='document_id',
                                                 annotator_col='annotator_id',
                                                 class_col='annotation')
0.743421052631579
Knowing How Good Our Data Is
Say you have a team of 5 annotators classifying documents into 10 classes. To ensure quality and move fast, you’ve had 2 annotators annotate each document, and using LightTag, each document is labeled by a different pair of annotators.
Your output will look something like this.
| document_id | annotator_id | annotation | |
|---|---|---|---|
| 0 | 1 | B | 1 |
| 6 | 3 | B | 2 |
| 7 | 3 | C | 2 |
| 9 | 4 | B | 1 |
| 10 | 4 | C | 1 |
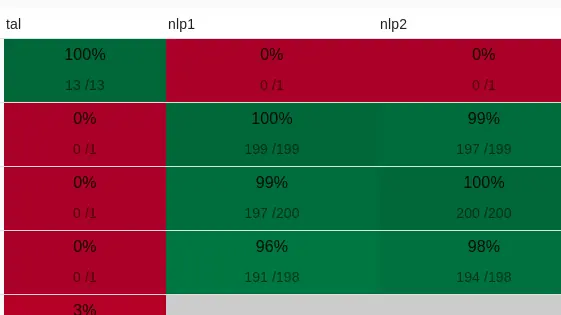
You need to know is if your output is any good. Is your labeled data reliable. One option is to calculate an agreement matrix, but those are hard to interpret and communicate about.
What you want is one number that tells you how reliable your data is.
You’re stepping into the lovely world of Inter-Annotator-Agreement and Inter-Annotator-Reliability and at first glance you’re spoiled for choice. Scott’s Pi and Cohen’s Kappa are commonly used and Fleiss’ Kappa is a popular reliability metric and even well loved at Hugging Face.
The canonical measure for inter-annotator agreement for categorical classification (without a notion of ordering between classes) is Fleiss’ kappa.
See the Wikipedia article here. — Julien Chaumond (@julien_c), May 1, 2019
However, none of these metrics support our case, where not every annotator labeled every example nor can we guarantee that every example was labeled exactly twice (or 3 times). Maybe some were labeled more by accident and some weren’t labeled by two people yet.
Luckily, we can use Krippendorff’s Alpha. Krippendorff’s Alpha has a few traits that make it very well suited to our case. It supports
- Any number of observers, not just two
- Any number of categories, scale values, or measures
- Incomplete or missing data
- Large and small sample sizes alike, not requiring a minimum
The catch, it’s hard to compute and calculate.
Making Sure Reliability Measures are Reliable
A Python package that calculates Krippendorff’s Alpha already exists. We found two things that were challenging with it and drove us to write this post and our implementation.
A More Intuitive API
First, It’s hard to come to Krippendorff’s Alpha and know how to format your data in the right way. The available package assumes you do, but if you’re just guessing it’s hard to know if you did it right or got a random number. The package’s API looks like this:
def krippendorff_alpha(data, metric=interval_metric, force_vecmath=False, convert_items=float, missing_items=None):
    '''
    Calculate Krippendorff's alpha (inter-rater reliability):

    data is in the format
    [
        {unit1:value, unit2:value, ...},  # coder 1
        {unit1:value, unit3:value, ...},   # coder 2
        ...                            # more coders
    ]
    or
    it is a sequence of (masked) sequences (list, numpy.array, numpy.ma.array, e.g.) with rows corresponding to coders and columns to items

    metric: function calculating the pairwise distance
    force_vecmath: force vector math for custom metrics (numpy required)
    convert_items: function for the type conversion of items (default: float)
    missing_items: indicator for missing items (default: None)
    '''
But what exactly should data look like and how to get there from our original data is unclear. Remember, we started with
| document_id | annotator_id | annotation | |
|---|---|---|---|
| 0 | 1 | B | 1 |
| 6 | 3 | B | 2 |
| 7 | 3 | C | 2 |
| 9 | 4 | B | 1 |
| 10 | 4 | C | 1 |
Validating Ourselves
Second, and very much driven by the first point, we wanted to make sure we understood the statistic and how it’s calculated so that we knew what it means and could formulate a simpler maybe even foolproof API.
The next part of this blog post walks simpledorffs implementation.
Calculating Krippendorff’s Alpha in Python With Pandas
There are a few equivalent ways to calculate Krippendorff’s Alpha, and here we want to show a Python Implementation of Krippendorff’s General method, published in the last section here. This isn’t the method in Wikipedia, but we found it easier to grok and work with.
Terminology and Data Transforms
Let’s get some terminology set up and then show the code.
Krippendorff talks about units, e.g. a single thing being classified by multiple people. In our case, a unit is a document being classified.
Krippendorff assumes an input in table format. Each row in the table corresponds to an annotator. And each column in the table corresponds to a unit/document. In the original table, a unit corresponds to a document_id.
| annotator_id | 1 | 2 | 3 | 4 | 5 | 6 | 7 | 8 | 9 | 10 | 11 | 12 |
|---|---|---|---|---|---|---|---|---|---|---|---|---|
| A | 1 | 2 | 3 | 3 | 2 | 1 | 4 | 1 | 2 | nan | nan | nan |
| B | 1 | 2 | 3 | 3 | 2 | 2 | 4 | 1 | 2 | 5 | nan | 3 |
| C | nan | 3 | 3 | 3 | 2 | 3 | 4 | 2 | 2 | 5 | 1 | nan |
| D | 1 | 2 | 3 | 3 | 2 | 4 | 4 | 1 | 2 | 5 | 1 | nan |
Here’s the code the goes from our original table to Krippendorff’s format
def df_to_experiment_annotator_table(df,experiment_col,annotator_col,class_col):
        return df.pivot_table(
        index=annotator_col, columns=experiment_col, values=class_col, aggfunc="first"
    )

df_to_experiment_annotator_table(original_data,'document_id','annotator_id','annotation')
Krippendorff wants to calculate two quantities from this table, the observed number of disagreements (Do) and an Estimate of the likelihood of a disagreement occurring by chance (De).
Notice that the calculation happens “in the negative”, we’re thinking about the likelihood of bad things happening and convert that into a “positive” measure of reliability at the end. If the likelihood of bad things happening is low then our data is reliable.
The likelihood of “bad things happening” is simply to the ratio of Do to De. We observe the number of disagreements and compare it to the number of disagreements we’d expect to see by chance. If we see far fewer disagreements than chance would expect, then our data is reliable. If we see far more agreements than chance would predict, then we can assume there is a systematic problem (someone is maliciously annotating). Somewhere in between and we need to talk with our team and figure out what’s going wrong. (LightTag has analytical tools to deep dive and review).
The actual math for calculating Krippendorff’s alpha is simple, however, the calculation requires some data wrangling kung-fu that can get tricky. Krippendorff’s generic recipe goes like this:
The Recipe
Take your input table of experiments and transform it into a new table, where each column is an experiment/unit and each row corresponds to a possible class. The value of a cell at Unit(Column) i and Class(Row) j is the number of annotations of Unit i with class J
| 1 | 2 | 3 | 4 | 5 | 6 | 7 | 8 | 9 | 10 | 11 | 12 | |
|---|---|---|---|---|---|---|---|---|---|---|---|---|
| 1 | 3 | 0 | 0 | 0 | 0 | 1 | 0 | 3 | 0 | 0 | 2 | 0 |
| 2 | 0 | 3 | 0 | 0 | 4 | 1 | 0 | 1 | 4 | 0 | 0 | 0 |
| 3 | 0 | 1 | 4 | 4 | 0 | 1 | 0 | 0 | 0 | 0 | 0 | 1 |
| 4 | 0 | 0 | 0 | 0 | 0 | 1 | 4 | 0 | 0 | 0 | 0 | 0 |
| 5 | 0 | 0 | 0 | 0 | 0 | 0 | 0 | 0 | 0 | 3 | 0 | 0 |
Our new table is interesting because a value higher than one indicates there was an agreement in the respective unit and class.
- Disagreement in a particular unit(experiment) is any column that has more than one value.
- In a particular unit(experiment), if we multiply two non-zero values the result is the total number of disagreements for that pair.
- If we take the sum of the products in a column and divide it by 1 minus the sum of the entire column, we get the disagreement rate for that unit (experiment).
- Summing that across all columns gives us the observed disagreement rate.
- Notice that unit 12, in bold, has only one response, and so it has no agreement information. We’ll need to handle that case.
That’s the hard part. Now the easy part. We need to compute an estimate of disagreement by chance, which we do by multiplying the frequencies of each class in the experiment with the frequencies of the other classes. Taking the sum of those products gives us De.
Finally, we take the ratio of Do to De and multiply by 1 minus the total observations to get the sample estimate of the ratio of disagreements to the ratio of disagreements we’d expect under chance. Subtracting that from 1 gives us our reliability score.
The Code
Below is an implementation of the above recipe.
Preparing The Table
First, we make our table mapping Values To Units
def make_value_by_unit_table_dict(experiment_annotator_df):
    """

    :param experiment_annotator_df: A dataframe that came out of  df_to_experiment_annotator_table
    :return: A dictionary of dictionaries (e.g. a table) whose rows (first level) are experiments and columns are responses
            {1: Counter({1.0: 1}),
             2: Counter(),
             3: Counter({2.0: 2}),
             4: Counter({1.0: 2}),
             5: Counter({3.0: 2}),
            """
    data_by_exp = experiment_annotator_df.T.sort_index(axis=1).sort_index()
    table_dict = {}
    for exp, row in data_by_exp.iterrows():
        vals = row.dropna().values
        table_dict[exp] = Counter()
        for val in vals:
            table_dict[exp][val] += 1
    return table_dict
Masking Units with less than two annotations
The next step is to fix column 12 that only had a single annotator. We need to only look at units that had at least two annotators, because we’re working with agreement data
    vbu_df = (
        pd.DataFrame.from_dict(vbu_table_dict, orient="index")
        .T.sort_index(axis=0)
        .sort_index(axis=1)
        .fillna(0)
    )
    ubv_df = vbu_df.T
    vbu_df_masked = ubv_df.mask(ubv_df.sum(1) == 1, other=0).T
| 1 | 2 | 3 | 4 | 5 | 6 | 7 | 8 | 9 | 10 | 11 | 12 | |
|---|---|---|---|---|---|---|---|---|---|---|---|---|
| 1 | 3 | 0 | 0 | 0 | 0 | 1 | 0 | 3 | 0 | 0 | 2 | 0 |
| 2 | 0 | 3 | 0 | 0 | 4 | 1 | 0 | 1 | 4 | 0 | 0 | 0 |
| 3 | 0 | 1 | 4 | 4 | 0 | 1 | 0 | 0 | 0 | 0 | 0 | 0 |
| 4 | 0 | 0 | 0 | 0 | 0 | 1 | 4 | 0 | 0 | 0 | 0 | 0 |
| 5 | 0 | 0 | 0 | 0 | 0 | 0 | 0 | 0 | 0 | 3 | 0 | 0 |
Convenience Calculations
We calculate some things that make the next code easier to work with
def calculate_frequency_dicts(vbu_table_dict):
    """

    :param vbu_table_dict: A value by unit table dictionary, the output of  make_value_by_unit_table_dict
    :return: A dictionary of dictonaries
        {
            unit_freqs:{ 1:2..},
            class_freqs:{ 3:4..},
            total:7
        }
    """
    vbu_df = (
        pd.DataFrame.from_dict(vbu_table_dict, orient="index")
        .T.sort_index(axis=0)
        .sort_index(axis=1)
        .fillna(0)
    )
    ubv_df = vbu_df.T
    vbu_df_masked = ubv_df.mask(ubv_df.sum(1) == 1, other=0).T
    return dict(
        unit_freqs=vbu_df_masked.sum().to_dict(),
        class_freqs=vbu_df_masked.sum(1).to_dict(),
        total=vbu_df_masked.sum().sum(),
    )
Calculate The Disagreement Rate Expected By Chance
def calculate_de(frequency_dicts, metric_fn):
    """
    Calculates the expected disagreement by chance
    :param frequency_dicts: The output of data_transforms.calculate_frequency_dicts e.g.:
        {
            unit_freqs:{ 1:2..},
            class_freqs:{ 3:4..},
            total:7
        }
    :param metric_fn metric function such as nominal_metric
    :return: De a float
    """
    De = 0
    class_freqs = frequency_dicts["class_freqs"]
    class_names = list(class_freqs.keys())
    for i, c in enumerate(class_names):
        for k in class_names:
            De += class_freqs[c] * class_freqs[k] * metric_fn(c, k)
    return De
Calculate The Observed Disagreement Rate
def calculate_do(vbu_table_dict, frequency_dicts, metric_fn):
    """

    :param vbu_table_dict: Output of data_transforms.make_value_by_unit_table_dict
    :param frequency_dicts: The output of data_transforms.calculate_frequency_dicts e.g.:
        {
            unit_freqs:{ 1:2..},
            class_freqs:{ 3:4..},
            total:7
        }
    :param metric_fn: metric_fn metric function such as nominal_metric
    :return:  Do a float
    """
    Do = 0
    unit_freqs = frequency_dicts["unit_freqs"]
    unit_ids = list(unit_freqs.keys())
    for unit_id in unit_ids:
        unit_classes = list(vbu_table_dict[unit_id].keys())
        if unit_freqs[unit_id] < 2:
            pass
        else:
            weight = 1 / (unit_freqs[unit_id] - 1)
            for i, c in enumerate(unit_classes):
                for k in unit_classes:
                    Do += (
                        vbu_table_dict[unit_id][c]
                        * vbu_table_dict[unit_id][k]
                        * weight
                        * metric_fn(c, k)
                    )
    return Do
And Finally Get Alpha
def calculate_krippendorffs_alpha(ea_table_df, metric_fn=nominal_metric):
    """

    :param ea_table_df: The Experiment/Annotator table, output from data_transforms.df_to_experiment_annotator_table
    :param metric_fn: The metric function. Defaults to nominal
    :return: Alpha, a float
    """
    vbu_table_dict = data_transforms.make_value_by_unit_table_dict(ea_table_df)
    frequency_dict = data_transforms.calculate_frequency_dicts(vbu_table_dict)
    observed_disagreement = calculate_do(
        vbu_table_dict=vbu_table_dict,
        frequency_dicts=frequency_dict,
        metric_fn=metric_fn,
    )
    expected_disagreement = calculate_de(
        frequency_dicts=frequency_dict, metric_fn=metric_fn
    )
    N = frequency_dict['total']
    alpha = 1 - (observed_disagreement / expected_disagreement)*(N-1)
    return alpha
Wrapping Up
Hopefully you can use this library without having to think about the code much, but if you’d like to contribute we’re happily accepting PRs. And if you need to get some labeled data to measure reliability on, try LightTag